For those of you who would like to read more about SQL Server in general, please find your way to my new blog, http://sqlservertoday.blogspot.com/
Please feel free to contact me at jason@longcast.net if you have any Deltek Vision questions.
Thanks, Jason
Tuesday, October 18, 2011
Friday, August 5, 2011
Adding indexes to speed up your Voucher Detail Report
I was working with a fellow business analyst today, and we were researching why some of our voucher detail reports were taking over 13 minutes to complete.
We took the right approach by gathering as much information as possible before attempting to fix the problem.
1)We started by profiling the database to capture the sql generated by the report.
2)We also ran PSSDiag while the report was running to collect information about the state of the SQL Server while the report was run.
3)Next we ran a Performance Analysis log on the PSSDiag output and also ran the SQL Server RML utilities against the trace files that were generated.
As you might have guessed, none of the steps taken above raised any red flags.
So, we took a look at the SQL that was captured by the profiler during the report creation. We parsed up the SQL and ran it manually within SQL Management Studio.
Initially, we were startled by how large the SQL statement was. After running it in Management studio, we were then concerned about the statement taking well over 13 minutes to produce a small number of rows.
We took the same SQL statement we ran it management studio and processed it through the Database Tuning Advisor and found that several indexes and statistics were missing and were recommended based on our sql statement.
I want to point out that the all of recommendations made by the database tuning advisor are highly dependent upon the options we used to run the voucher detail report and our configuration of our vision system. These same indexes may do nothing for you.
My goal of this post was to at least show the handful of indexes that reduced our query time from 13 minutes down to under 10 seconds. As I mentioned before, these queries may not work for your environment and may make reports run slower. As always, please test anything I am doing on this site on a development server and ensure proper testing before placing anything on a production environment.
Below are the indexes. Maybe you will consider something similar if you are having performance problems with your voucher detail reports.
CREATE NONCLUSTERED INDEX [NC_IDX_LedgerAP_CASH_REQ_1] ON [dbo].[LedgerAP]
(
[Voucher] ASC,
[Vendor] ASC,
[Line] ASC,
[WBS1] ASC,
[WBS2] ASC,
[WBS3] ASC,
[TransType] ASC,
[SubType] ASC,
[Period] ASC
)
INCLUDE ( [Account],
[Desc2],
[PartialPayment],
[Discount],
[BilledWBS1],
[BilledWBS2],
[BilledWBS3],
[BilledInvoice],
[TaxAmount],
[TransactionAmount],
[AmountSourceCurrency]) WITH (SORT_IN_TEMPDB = OFF, IGNORE_DUP_KEY = OFF, DROP_EXISTING = OFF, ONLINE = OFF) ON [PRIMARY]
go
CREATE NONCLUSTERED INDEX [NC_IDX_LedgerAP_CASH_REQ_2] ON [dbo].[LedgerAP]
(
[Voucher] ASC,
[Vendor] ASC,
[Line] ASC,
[TransType] ASC,
[WBS1] ASC,
[WBS2] ASC,
[WBS3] ASC,
[SubType] ASC,
[Period] ASC
)
INCLUDE ( [Account],
[Desc2],
[PartialPayment],
[Discount],
[BilledWBS1],
[BilledWBS2],
[BilledWBS3],
[BilledInvoice],
[TaxAmount],
[TransactionAmount],
[AmountSourceCurrency]) WITH (SORT_IN_TEMPDB = OFF, IGNORE_DUP_KEY = OFF, DROP_EXISTING = OFF, ONLINE = OFF)
go
CREATE NONCLUSTERED INDEX [NC_IDX_LEDGERAP_CASH_REQ_3] ON [dbo].[LedgerAR]
(
[AutoEntry] ASC,
[Invoice] ASC,
[WBS1] ASC,
[WBS2] ASC,
[WBS3] ASC,
[TransType] ASC,
[SubType] ASC
)
INCLUDE ( [AmountSourceCurrency]) WITH (SORT_IN_TEMPDB = OFF, IGNORE_DUP_KEY = OFF, DROP_EXISTING = OFF, ONLINE = OFF)
go
CREATE NONCLUSTERED INDEX [NC_IDX_LEDGERAR_CASH_REQ_1] ON [dbo].[LedgerAR]
(
[WBS1] ASC,
[Invoice] ASC,
[TransType] ASC,
[SubType] ASC,
[AutoEntry] ASC
)
INCLUDE ( [AmountSourceCurrency]) WITH (SORT_IN_TEMPDB = OFF, IGNORE_DUP_KEY = OFF, DROP_EXISTING = OFF, ONLINE = OFF)
go
CREATE NONCLUSTERED INDEX [NC_IDX_VO_CASH_REQ_1] ON [dbo].[VO]
(
[PaidPeriod] ASC,
[LiabCode] ASC,
[PayTerms] ASC,
[PaymentDate] ASC,
[Company] ASC,
[Vendor] ASC,
[Voucher] ASC,
[TransDate] ASC,
[BankCode] ASC,
[Invoice] ASC,
[InvoiceDate] ASC
)WITH (SORT_IN_TEMPDB = OFF, IGNORE_DUP_KEY = OFF, DROP_EXISTING = OFF, ONLINE = OFF)
go
CREATE NONCLUSTERED INDEX [NC_IDX_VO_CASH_REQ_2] ON [dbo].[VO]
(
[LiabCode] ASC,
[Company] ASC,
[PayTerms] ASC,
[Vendor] ASC,
[Voucher] ASC,
[TransDate] ASC,
[BankCode] ASC,
[Invoice] ASC,
[InvoiceDate] ASC
)WITH (SORT_IN_TEMPDB = OFF, IGNORE_DUP_KEY = OFF, DROP_EXISTING = OFF, ONLINE = OFF) ON [PRIMARY]
go
CREATE NONCLUSTERED INDEX [NC_IDX_VO_CASH_REQ_3] ON [dbo].[VO]
(
[LiabCode] ASC,
[Company] ASC,
[PayTerms] ASC,
[Vendor] ASC,
[Voucher] ASC
)WITH (SORT_IN_TEMPDB = OFF, IGNORE_DUP_KEY = OFF, DROP_EXISTING = OFF, ONLINE = OFF) ON [PRIMARY]
go
Wednesday, July 20, 2011
Capturing & Analyzing the Tempdb impact of the PRSummary build
In this series, I hope to get an understanding of how the PRSummary build has changed the way it interacts with tempdb from Vision 5.1 to Vision 6.1.
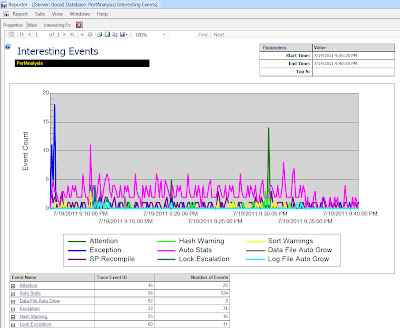
By clicking on the interesting events link, you will get an nice high level view of events that should be looked at.
Before we analyze the tempdb impact, I want to talk about how to use the tools to perform the analysis. There are a series of great software tools that I use and need to be installed on your servers in order to efficiently log the process. Not only do these tools to a good job logging activity, they also provide an amazing analysis interface.
I will list the tools out and where to get them, but as part of this post I will not walk you through how to install them and cannot guarantee version compatibility with your system. Again, we will go through the actual impact in an upcoming blog post.
Below are the tools
PAL (Performance Analysis of Logs) Tool
http://pal.codeplex.com/
http://pal.codeplex.com/
Powershell version 2.0
RML Utilities: Used in house by Microsoft support engineers to diagnose customer support issues.
Microsoft Report Viewer distributable
http://www.microsoft.com/download/en/details.aspx?id=6576
http://www.microsoft.com/download/en/details.aspx?id=6576
Log Parser: Allows querying against log, xml, csv and other windows files.
http://www.microsoft.com/download/en/details.aspx?id=24659
http://www.microsoft.com/download/en/details.aspx?id=24659
Performance Dashboard Reports: SSRS Reports used to monitor sql server from within management studio.
http://www.microsoft.com/download/en/details.aspx?id=22602
http://www.microsoft.com/download/en/details.aspx?id=22602
MSChart.exe: Utility for providing additional charting functionality.
http://www.microsoft.com/download/en/details.aspx?id=14422
http://www.microsoft.com/download/en/details.aspx?id=14422
PSSDIAG: Diagnostic utility to collection perfmon logs, sysmon logs, profiler traces, event logs.
http://www.microsoft.com/download/en/details.aspx?amp;amp;amp;amp;amp;amp;amp;DisplayLang=en&id=11886
http://www.microsoft.com/download/en/details.aspx?amp;amp;amp;amp;amp;amp;amp;DisplayLang=en&id=11886
Onto the fun part. How to use the tools.
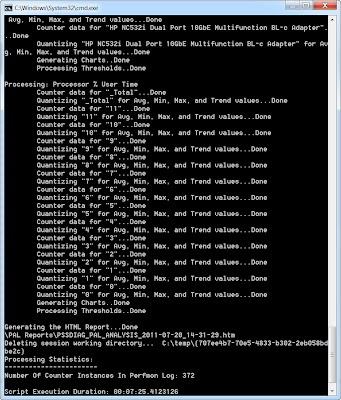
The first step in the collection process is starting PSSDiag.exe. For those of you, who are trying to do this as well in your environment, look for that executable in the directory where the install placed it, and run that executable as an administrator.
All you do to start it is just double click it. The executable will launch a command prompt that will generate several messages. The command prompt prints a message to the screen once it has finished initializing, signaling that it’s ready for testing. Below is the output generated from my when I clicked on the PSSDIAG.exe.
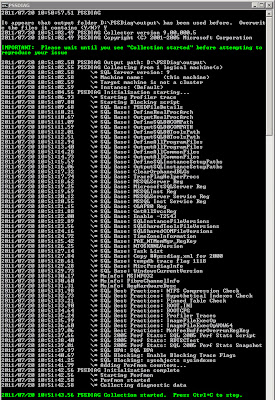
All you do to start it is just double click it. The executable will launch a command prompt that will generate several messages. The command prompt prints a message to the screen once it has finished initializing, signaling that it’s ready for testing. Below is the output generated from my when I clicked on the PSSDIAG.exe.

After starting PSSDiag, fire up something you want to monitor. I fired up the good ol' PRSummary build in Vision as my example. Based on the amount of data we have and the fact I was testing this on a dev box, our build takes anywhere between 20 and 40 minutes to complete.
Once your process you are monitoring finishes, hit Control + C in the command prompt which will stop PSSDiag. If you are running this for the first time, don't forget to do this, otherwise the collection process will eventually exhaust your disk space. One additional note, please remember to rename the output folder so that you can save your results without them being overwritten the next time PSSDIag is started.
So, I may have gotten ahead of myself, but all of the collection output and analysis files are stored into a folder called output within the PSSDiag installation directory. If you want to use the PAL tool, you will need to locate the .BLG file. This is the file you will open using the PAL tool.
Onto the PAL tool.
The PAL Tool assumes that you have a database name PerfAnalysis installed on your database server. I can't remember if the installation process created this or if I had to create this manually. Obviously, If you do not have one, you will need to create an empty database named PerfAnalysis. I
If you have installed PAL, it usually writes itself into the program files\PAL\ directory on your OS drive. Locate the PALWizard.exe and launch it.
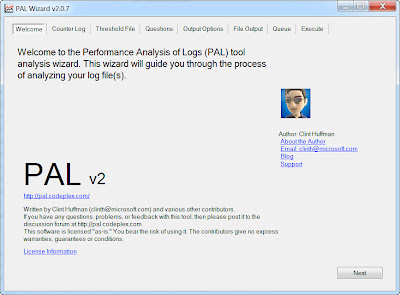
The PAL tool will walk you through a wizard type interface. The most important items to fill out are below. For simplicity, I will not share all of my server details with you.
1. Find the .BLG file in the output folder and use that for the counter log file path.
2. Threshold file title is the version of SQL Server that you are on.
3. Number of processors the SQL Server has that you performed your PSSDiag on.
4. If the 3GB switch is enabled on your SQL Server.
5. If your Server is 32 or 64 Bit.
6. How much memory you have on the server dedicated to SQL Server.
7. Next, next, next....finish.
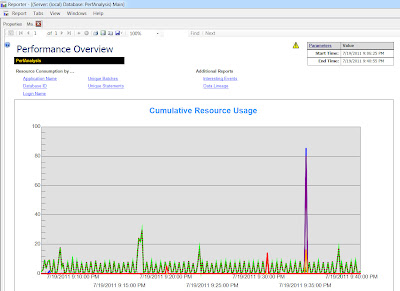
After clicking finish, there will be another command prompt launched which will give you the status of the output that PAL creates. PAL will create an HTM file that it will place in the PAL installation directory. This process will take several minutes and will increase in time depending on the size of your collection.
PAL produces an html file with several stats, charts and summaries. At the top of the web page, there are alerts by chronological order and by type of alert that allow you to drill down into the html file.
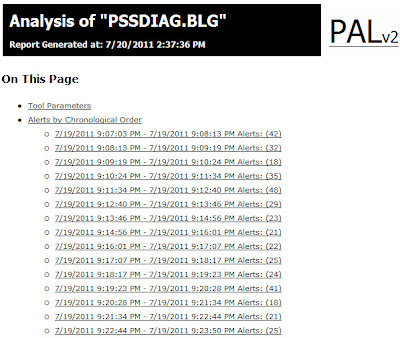
When drilling down, you will see something like the following.
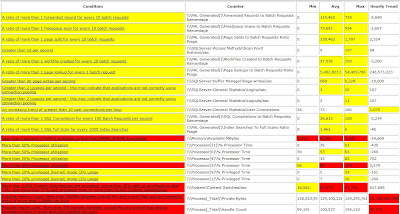
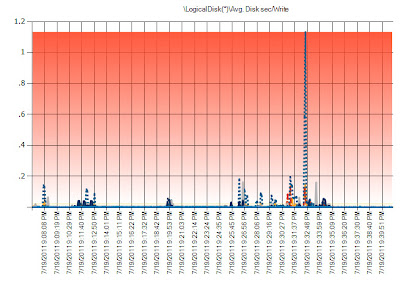
Like I mentioned before, there are charts as well.
RML is an additional type of utiltiy that Microsoft uses in house for testing. To fire up RML, launch the RML command prompt. It will be somewhere in your system tray or start menu.

The PAL tool will walk you through a wizard type interface. The most important items to fill out are below. For simplicity, I will not share all of my server details with you.
1. Find the .BLG file in the output folder and use that for the counter log file path.
2. Threshold file title is the version of SQL Server that you are on.
3. Number of processors the SQL Server has that you performed your PSSDiag on.
4. If the 3GB switch is enabled on your SQL Server.
5. If your Server is 32 or 64 Bit.
6. How much memory you have on the server dedicated to SQL Server.
7. Next, next, next....finish.
After clicking finish, there will be another command prompt launched which will give you the status of the output that PAL creates. PAL will create an HTM file that it will place in the PAL installation directory. This process will take several minutes and will increase in time depending on the size of your collection.

PAL produces an html file with several stats, charts and summaries. At the top of the web page, there are alerts by chronological order and by type of alert that allow you to drill down into the html file.

When drilling down, you will see something like the following.

Like I mentioned before, there are charts as well.

RML is an additional type of utiltiy that Microsoft uses in house for testing. To fire up RML, launch the RML command prompt. It will be somewhere in your system tray or start menu.
Type the following command in your RML prompt:
readtrace -IDriveLetter:\outputdirectory\nameofyourtracefile.trc -oDriveLetter:outputdirectory\yourchoiceoffilename
For example, my command was:
readtrace -ID:\Vision61Summary-output\Vision_sp_trace.trc -oD:\
Vision61Summary-output\Vision_PRSummaryOUTPUT

By clicking on the interesting events link, you will get an nice high level view of events that should be looked at.

Now that we have walked through the tools involved in capturing and analyzing output, this is probably a good place to finish this part of the post. Any further, and we will be entering the analysis of the PRSummary build.
I will follow up in a few days with a second post analyzing what I found in the output. Stay tuned and enjoy.
Thursday, July 7, 2011
Deltek Vision 61. SP4 Hot Fix #35
A fix has been made to ensure firing order on scheduled workflows. In the past, for both scheduled and user initiated work flows, the order of the events were not guaranteed.
According to the hot fix documentation:
“When a scheduled workflow was initiated, the ActionOrder field was not
referenced. This resulted in the actions not firing in the correct order."
This is great news. Next we want Deltek to ensure firing order on user initiated workflows.
Enjoy…
Thursday, June 23, 2011
Hot Fix #32, invoice previewing improvements...
Hot Fix #32, Invoice previewing performance enhancements.
Before I mention the invoice previewing preview enhancements, I wanted to mention to folks that some of Deltek’s hot fixes are accumulative. Each subsequent accumulative hot fix may not contain information about items already addressed and fixed in prior hot fixes.
Invoice previewing improvements were introduced in Hot Fix #31 and are also included in Hot Fix #32. What some folks out in the user community were experiencing were small delays in while previewing invoices. These delays were seen as pauses between running the preview and then actually seeing the “Green Wheel” turn on the Microsoft SQL Server report. In addition, once the “Green Wheel” started to turn, the report did not take much time to run at all, but delays were seen up to that point.
I ran fiddler on our systems and took a screen shot of the delay I discussed. As seen below, the majority of the previewing time occurred during the “Building Report phase” which was occurring in the MethodCall .Net code.

Deltek has included performance improvement related to the building of the report which will reduce previewing times. It’s important to note that there is a one-time previewing delay each time a new template is loaded for preview, but all subsequent previews using the same template should see much better performance.
Enjoy....
Thursday, May 26, 2011
Hot Fix #32 for Vision 6.1 SP4
Hot Fix #32
Hot fix #32 contains two important performance improvements that were fixed in Hot fix #31. I'll cover one of the improvements below, and will post another entry later discussing the second performance fix.
The first performance improvement is related to a delete statement that is run in the background and is triggered my multiple events during a user’s activity within Vision. The delete statement below was responsible for clearing out old entries in the workflow log table.
DELETE From WorkflowLog WHERE
datediff(dd,WorkflowTime,GETUTCDATE()) >
(SELECT WorkflowLogLength from CFGSystem )
Based on the execution plan below, you can see that this is a less than ideal delete statement, and the performance degradation is multiplied if you are keeping millions of rows in your workflowlog table.

As part of Hot Fix #32, Deltek re-worked the delete statement and it looks something like what is listed below.
DELETE From WorkflowLog WHERE WorkflowTime < @datevariable
Based on the execution plan below, you can see the plan is much simpler and leads to better overall performance.

If you want to squeeze out even better performance, add a non clustered index on the workflowtime column for the workflowlog table.
Enjoy
Friday, November 5, 2010
Creating an Atom Feed from Vision reports
Vision 6.1 SP4 now supports SSRS 2008 R2. R2 has many new features that include Atom rendering extensions. This means a report can be a data feed. What this really means is that a report can be a data source that can be used by any application that can consume a feed.
For example, Excel 2010 with PowerPivot can consume an Atom Feed. For the most part, anything that can consume XML can also consume an ATOM feed.
I tested this out by going to the ReportManager URL for our SSRS 2008 R2 reporting server that is used by Vision. The default URL for most R2 installations usually looks something like this: http://YOUR_REPORT_SERVER_NAME/Reports_SQL2008R2
Find your Vision report and run the report. You should notice an orange icon in which I have highlighted with a red box around it. This is the export to data feed icon.
See the screen shot below.


When you click the orange icon, you will be prompted to save the atom feed. An improtant note about the screen shot below is if you have Excel 2010 installed from the machine you are exporting the data feed to, you will have an "Open" button to open directly into excel.

I chose to save the Atom file, which you then can open in any text editor to view, or you can view directly in your browser like the screen shot below.

Although it may be hard to detect based on my poor screen shot, you will see a URL listed in the collection XML tag. If you replace the "&" to "&" in the URL, copy and paste it into your browser, you will get an enormous XML data dump of the contents of the report. This is the XML output from the data feed.
From here, you can choose to open the XML or just the .atomsvc file directly in Excel 2010, or in any other data feed consumer and your Vision reports can be a datasource for the Web 2.0 revolution.
Enjoy!!!
Subscribe to:
Posts (Atom)